
A comprehensive technical guide to implementing an adaptive, investigative financial analysis system using LangGraph, Pydantic, and Retrieval-Augmented Generation
Technical Introduction
Financial analysis is complex, requiring the integration of internal company data with macroeconomic indicators, industry trends, and qualitative assessments. Traditional approaches involve specialists manually gathering and interpreting diverse datasets - a time-consuming process with inconsistent results.
We've developed a solution that leverages Large Language Models (LLMs) within a structured graph workflow to automate and enhance this process. This architecture enables:
- Systematic investigation of financial hypotheses
- Evidence gathering across multiple data sources
- Dynamic visualization of insights
- Confidence-scored analysis
Our system employs the LangGraph framework to orchestrate a multi-step investigative workflow, structured with Pydantic for type safety, and enhanced with retrieval-augmented generation (RAG) to incorporate domain-specific knowledge.
System Architecture
The financial analysis agent operates as a directed graph with distinct nodes handling specific responsibilities:
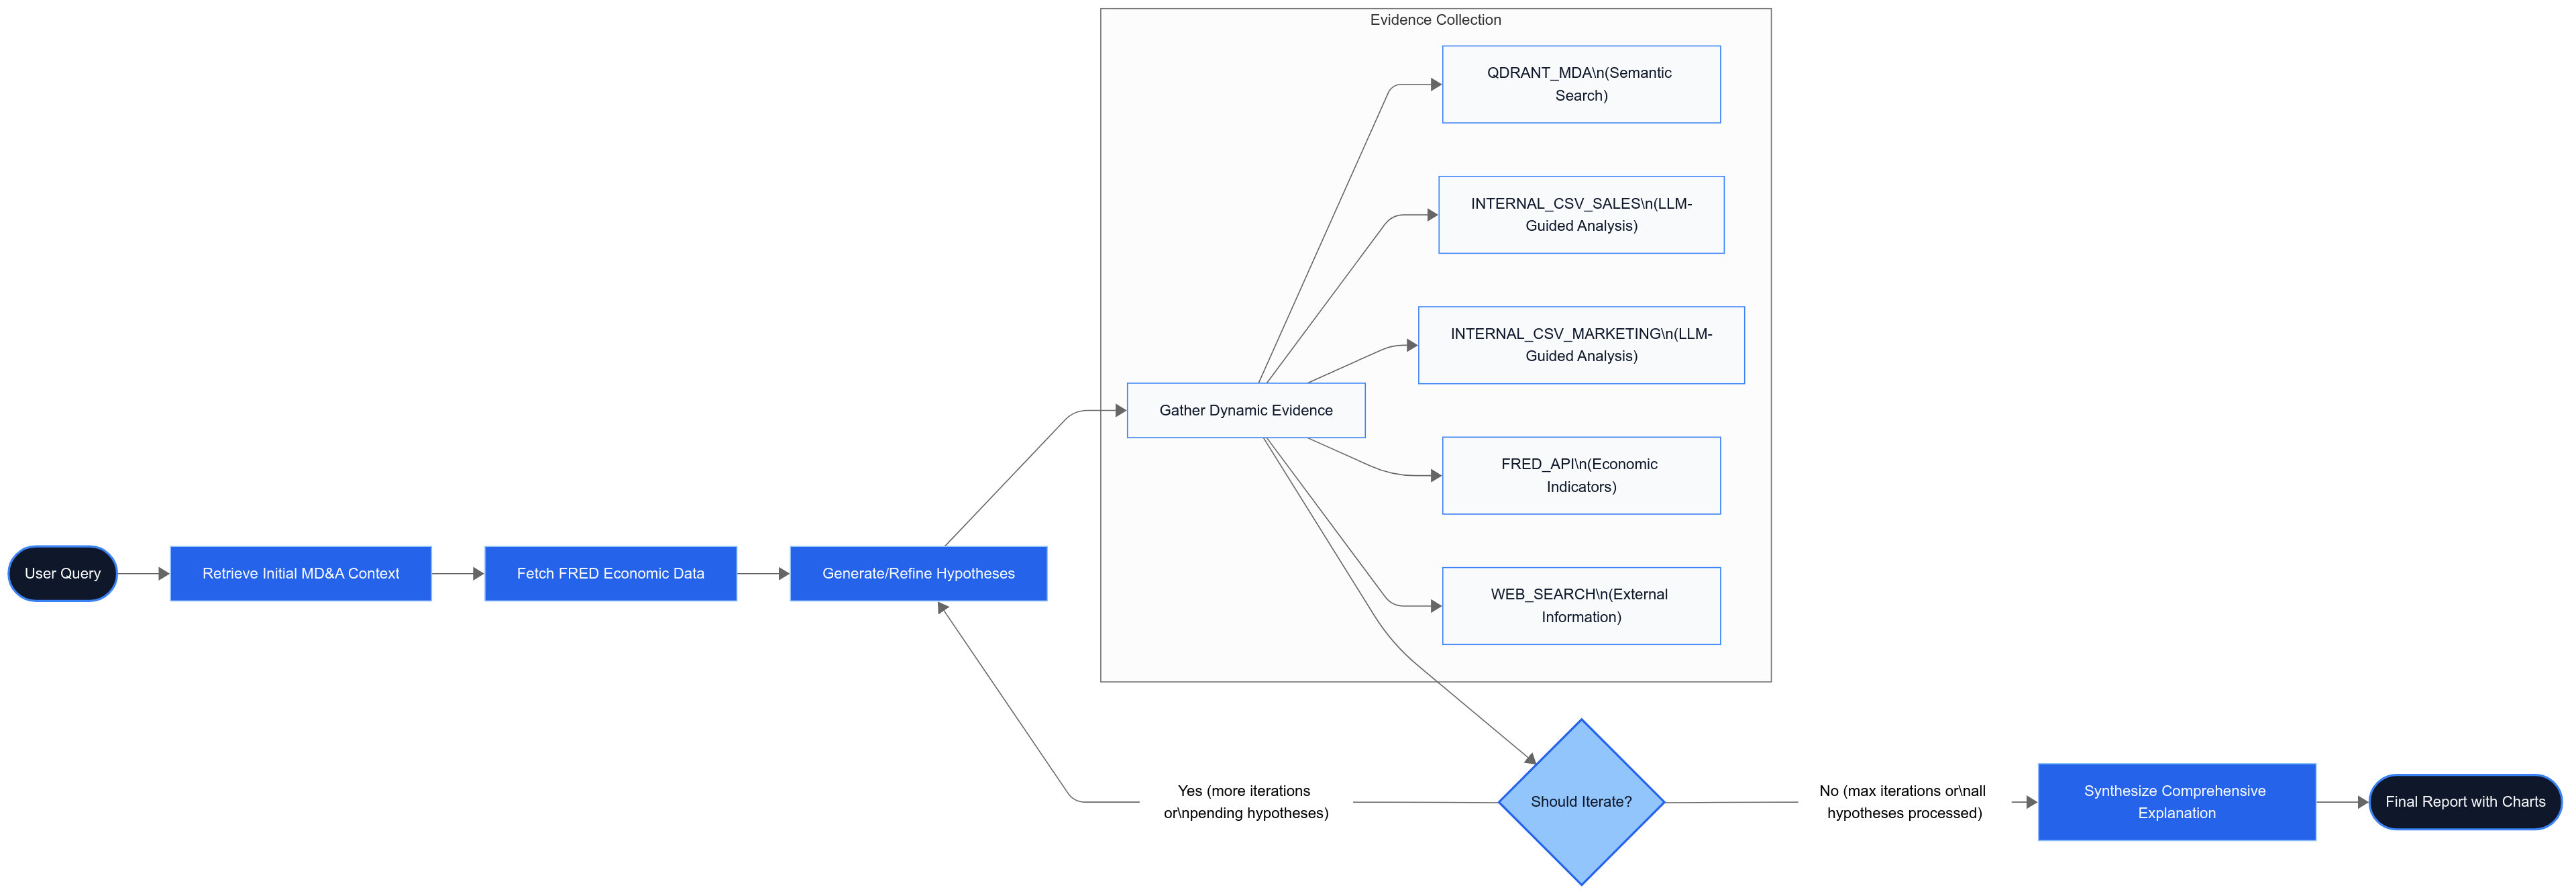
Each node represents a function that takes the agent's state as input, performs its specialized task, and returns an updated state with new information:
1def retrieve_initial_mda_context_node(state: AgentState) -> AgentState:
2    # Retrieve and add context to state
3    return updated_state
4
5def fetch_fred_data_node(state: AgentState) -> AgentState:
6    # Fetch economic data and add to state
7    return updated_state
8
The core state object maintains all information throughout the process:
1class AgentState(TypedDict):
2    original_query: str
3    primary_document_path: Optional[str]
4    primary_vector_store_path: Optional[str]
5    initial_mda_contexts: Optional[List[Dict[str, Any]]]
6    sales_data_path: Optional[str]
7    marketing_data_path: Optional[str]
8    fred_api_key: Optional[str]
9    fred_series_ids: Optional[List[str]]
10    external_economic_data: Optional[Dict[str, List[Dict[str, Any]]]]
11    hypotheses: Optional[List[Dict[str, Any]]]
12    gathered_evidence: Optional[List[Dict[str, Any]]]
13    charts_for_report: Optional[List[StructuredChart]]
14    current_iteration: int
15    max_iterations: int
16    report_content: Optional[List[ReportItem]]
17    error_message: Optional[str]
18    final_report_generated: bool
19
LangGraph Concurrency Multiple evidence-gathering nodes may run in parallel. Guard shared lists (`gathered_evidence`) with thread-safe updates or use a dedicated "Aggregator" node to merge child results deterministically. GitHub discussions indicate this is a common implementation pitfall when scaling LangGraph applications in production environments.
Deep Research: First Principles for Evidence-Based Financial Analysis
At its core, our system applies four fundamental principles of effective financial research:
1. Hypothesis-Driven Investigation
Rather than aimlessly analyzing data, we structure investigation around testable hypotheses:
1class HypothesisOutput(BaseModel):
2    id: str = Field(description="Unique identifier for the hypothesis")
3    text: str = Field(description="The full text of the hypothesis")
4    confidence: float = Field(description="A score between 0.0 and 1.0 indicating confidence")
5    status: str = Field(description="Current status: 'pending', 'investigated', 'confirmed', etc.")
6
This approach ensures focused analysis and allows for precise tracking of confidence levels.
2. Multi-Source Evidence Gathering
True insight emerges from triangulating multiple data sources:
1DataSourceType = Literal[
2    "QDRANT_MDA",
3    "INTERNAL_CSV_SALES",
4    "INTERNAL_CSV_MARKETING",
5    "FRED_API",
6    "WEB_SEARCH"
7]
8
For example, when investigating revenue changes, the system may:
- Retrieve qualitative insights from MD&A documents
- Analyze quantitative sales data from internal CSVs
- Correlate with economic indicators from FRED
Note-Align Time-Series Granularity FRED macro data is often monthly/quarterly while sales CSVs are daily. Resample both series to a common granularity (e.g., monthly averages) before correlation to avoid spurious insight ("correlation-by-time-shift" bias). The FRED API allows frequency aggregation through its observation endpoints, which can help align time-series data properly.
3. Iterative Refinement
Initial hypotheses rarely capture the full picture. Our system employs an iterative approach:
1def should_iterate_node(state: AgentState) -> Literal["refine_hypotheses", "synthesize_comprehensive_explanation"]:
2    current_iter = state.get("current_iteration", 0)
3    max_iter = state.get("max_iterations", 1)
4
5    pending_hypotheses = any(h.get("status") == "pending" for h in state.get("hypotheses", []))
6    if not pending_hypotheses and current_iter > 0:
7        return "synthesize_comprehensive_explanation"
8
9    return "refine_hypotheses"
10
This creates a feedback loop where new evidence informs hypothesis refinement until convergence.
Tip — Enable Iteration Short-Circuit Add a *time-budget* or *cost-budget* guard in `should_iterate_node`. If runtime or spend exceeds a threshold, jump straight to synthesis with a "partial findings" flag to optimize for performance in production environments.
4. Quantified Uncertainty
Financial analysis inherently involves uncertainty. We make this explicit through confidence scoring:
1# Example hypothesis with confidence score
2{
3    "id": "H1",
4    "text": "The deceleration in revenue growth is primarily due to external macroeconomic factors",
5    "confidence": 0.75,
6    "status": "confirmed"
7}
8
Note — Confidence ≠ Probability Confidence scores are relative signals produced by the LLM, not calibrated probabilities. Run periodic calibration if you must treat them as probabilities in downstream risk models.
System Flow: Building Confidence Through Iterative Analysis
The agent's investigative process incorporates confidence assessment at multiple stages, creating a transparent and traceable analysis path:
Confidence-Driven Hypothesis Generation
Each hypothesis is assigned a numerical confidence score (0.0-1.0) by the LLM based on:
1class HypothesisOutput(BaseModel):
2    id: str = Field(...)
3    text: str = Field(...)
4    confidence: float = Field(description="A score between 0.0 and 1.0 indicating confidence in the hypothesis.")
5    status: str = Field(...)
6- Initial Scoring: When generating hypotheses, the LLM evaluates how well each potential explanation aligns with the MD&A context and economic data
- Quantified Uncertainty: Presenting financial insights with calibrated confidence scores (e.g., "75% confidence") helps users understand the reliability of different explanations
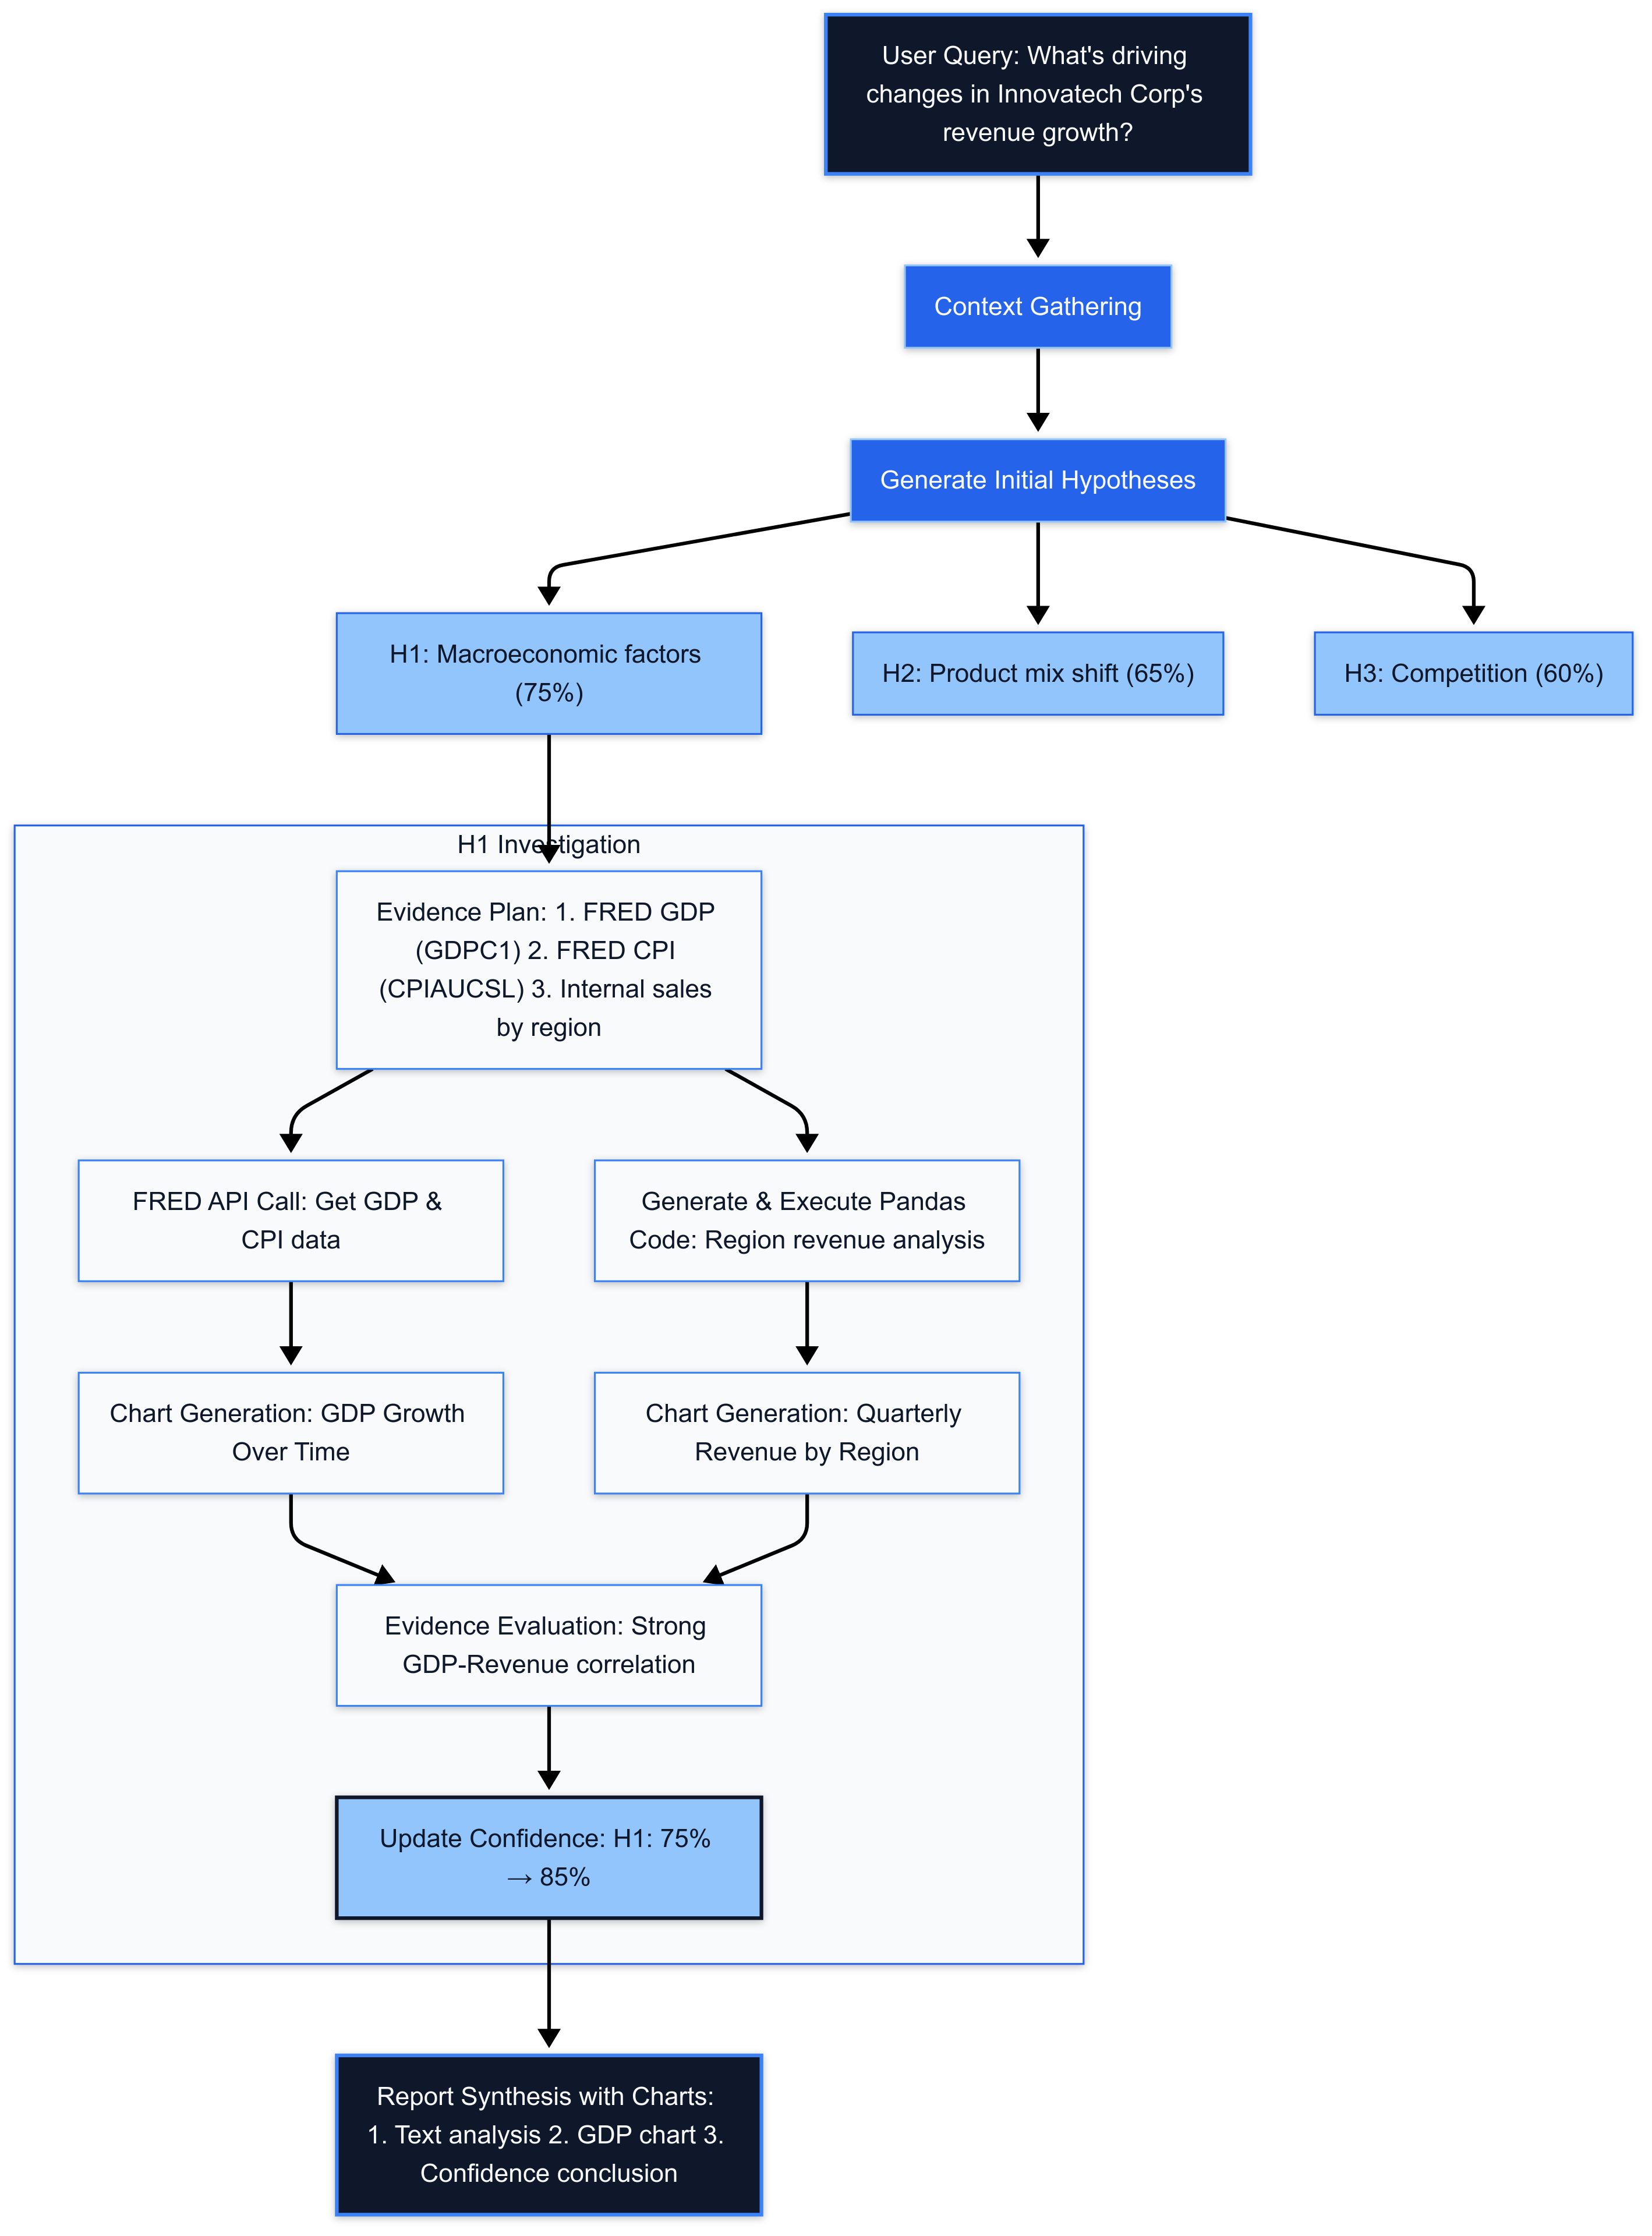
Evidence-Based Confidence Refinement
As the system iterates through evidence gathering:
- Confidence Evolution: During hypothesis refinement, scores are dynamically adjusted- Evidence supporting a hypothesis increases its confidence score- Contradictory evidence decreases confidence
- Status Tracking: The system maintains hypothesis status (`pending`, `investigated`, `confirmed`, `refuted`) alongside confidence
- Evidence Quality Assessment: The `executed_success` or `executed_error` status of evidence gathering directly impacts confidence in related hypotheses
1# After processing all actions for a hypothesis, determine its overall status
2all_actions_successful = True
3any_action_executed = False
4for ev_item in state["gathered_evidence"]:
5    if ev_item.get("hypothesis_id") == hypo_id:
6        if ev_item.get("status") == "executed_success":
7            any_action_executed = True
8        elif ev_item.get("status") == "executed_error":
9            all_actions_successful = False
10            any_action_executed = True # an attempt was made
11
Transparency Through Visual Confidence Indicators
The final report integrates confidence scores:
- Explicit Confidence Display: Hypotheses are presented with their confidence scores (e.g., "Hypothesis H1 (Confidence: 75%)")
- Evidence-Hypothesis Mapping: Charts and evidence points are linked to specific hypotheses, creating a clear audit trail
This confidence-centric design allows users to:
- Distinguish between high-confidence insights and speculative possibilities
- Understand the evidential basis for each conclusion
- Make informed decisions with appropriate levels of caution
Technical Components and Implementation
Structured Data Flow with Pydantic
Type safety is crucial for a complex system integrating multiple data sources. We use Pydantic throughout:
1class StructuredChart(TypedDict):
2    chart_id: str
3    chart_type: ChartType
4    title: str
5    data: List[ChartDataPoint]
6    x_axis_key: Optional[str]
7    y_axis_keys: Optional[List[str]]
8    description: Optional[str]
9
10class EvidenceSourceAction(BaseModel):
11    data_source: DataSourceType = Field(...)
12    query_or_parameters: Union[str, Dict[str, Any]] = Field(...)
13    reasoning: str = Field(...)
14    chart_suggestion: Optional[ChartSuggestion] = Field(...)
15
This enforces data validation at runtime and enables structured LLM outputs.
Note — Protect Internal PII Never embed raw customer-level finance records. Mask personal identifiers, aggregate at the cohort level, or vectorize on-prem and push only embeddings to Qdrant to avoid leaking sensitive data through prompts or logs. Security research confirms that vector databases like Qdrant require application-level encryption to fully protect against PII exposure.
Best Practice — Unit-Test Every Node For each LangGraph node, write a small deterministic test that feeds a stubbed state and asserts the returned schema. This catches drift when prompts or schemas change. The LangGraph documentation recommends node-level testing strategies for reliable production deployments.
LLM-Driven Chart Generation
The system dynamically creates visualizations based on LLM suggestions:
1def _create_chart_from_suggestion(
2    hypothesis_id: str,
3    action_data_source: DataSourceType,
4    chart_suggestion: ChartSuggestion,
5    retrieved_data: List[Dict[str, Any]],
6    charts_for_report_list: List[StructuredChart]
7) -> Union[str, Dict[str, str]]:
8    # Chart creation logic
9    # ...
10    new_chart = PydanticStructuredChart(
11        chart_id=chart_id,
12        chart_type=chart_suggestion.chart_type,
13        title=chart_suggestion.title_suggestion,
14        data=chart_data_points,
15        x_axis_key=x_key_to_use,
16        y_axis_keys=y_keys_to_use,
17        description=f"Chart generated for Hypothesis {hypothesis_id} from {action_data_source} data."
18    )
19
20    charts_for_report_list.append(new_chart.model_dump())
21    return chart_id
22
This allows dynamic visualization of evidence while maintaining traceability to specific hypotheses.
Note — Chart Suggestion Prompt "When suggesting a chart, always specify: `chart_type`, `x_axis_key`, `y_axis_keys`, and a `title_suggestion`. Skip chart creation if the retrieved data has < 3 points." Explicit format instructions help prevent "hallucination" of non-existent charts.
Economic Data Integration with FRED API
The system incorporates external economic indicators through the FRED API:
1def _execute_fred_api_action(
2    action: EvidenceSourceAction,
3    api_key: Optional[str],
4    existing_fred_data: Optional[Dict[str, List[Dict[str, Any]]]]
5) -> Dict[str, Any]:
6    # Extract series ID from action
7    # Check for cached data
8    # Fetch from FRED API if needed
9    url = f"https://api.stlouisfed.org/fred/series/observations"
10    params = {
11        "series_id": series_id_to_fetch,
12        "api_key": api_key,
13        "file_type": "json",
14        "observation_start": start_date_str,
15        "observation_end": end_date_str,
16        "sort_order": "asc"
17    }
18    # Process response and return data
19
This enables correlation between company performance and broader economic trends.
Intelligent Document Retrieval with RAG
The system integrates content from MD&A documents using retrieval-augmented generation:
1def retrieve_initial_mda_context_node(state: AgentState) -> AgentState:
2    # ...
3    try:
4        embeddings = OpenAIEmbeddings(openai_api_key=settings.openai_api_key, model=settings.embedding_model)
5
6        qdrant_store = Qdrant.from_existing_collection(
7            embedding=embeddings,
8            path=vector_store_path,
9            collection_name=QDRANT_COLLECTION_NAME,
10        )
11
12        retrieved_docs: List[Document] = qdrant_store.similarity_search(query, k=3)
13
14        initial_contexts = []
15        for doc in retrieved_docs:
16            initial_contexts.append(
17                {"id": doc.metadata.get("id", f"doc_{len(initial_contexts)}"),
18                 "text": doc.page_content,
19                 "metadata": doc.metadata}
20            )
21        # ...
22
This provides crucial context from company documents to inform hypothesis generation.
Note — Prompt Injection via Web Search Strip HTML/JS, run a profanity/regex filter, and optionally summarize with a separate LLM before sending web results to your main reasoning model. The OWASP Top 10 for LLM Security identifies indirect prompt injection via web search as a significant risk for LLM agents.
Performance and Scalability Considerations
Memory Efficiency
The system is designed to handle large datasets efficiently:
- Streaming Data Approach: Economic data is processed in chunks rather than loaded entirely in memory
- Vector Store Indexing: Document search uses efficient ANN algorithms via Qdrant for sub-linear ANN retrieval performance
- State Management: The TypedDict approach allows selective updates to the state without copying large data structures
Performance Tip — Batch Embedding Calls Embed chunks in batches of 96–128 tokens to maximize OpenAI throughput; this alone can cut embedding cost by 30-40%. Batching also improves performance and latency when processing large documents.
Request Batching
To minimize API costs and latency:
1# Processing multiple hypotheses in one iteration
2for hypo in pending_hypotheses:
3    # Generate evidence plan once per hypothesis
4    evidence_plan_output = _llm_call_create_evidence_gathering_plan(...)
5
6    # Execute multiple actions from the plan
7    for action_idx, action in enumerate(evidence_plan_output.actions):
8        # Execute action...
9
Response Time Optimization
Balancing thoroughness with responsiveness:
- Caching FRED Data: Economic data is cached to avoid redundant API calls
- Parameterized Iteration Control: The max_iterations parameter allows trading off depth for speed
- Progressive Reporting: The system can return partial results before all iterations complete
Implementation Pitfalls and Technical Debt
LLM Instruction Optimization
Careful prompt engineering is critical:
1prompt_template_str = f"""You are an expert financial analyst AI. Your task is to synthesize a comprehensive, easy-to-read financial report based on the provided information. The report should interleave textual explanations with relevant charts.
2
3Context:
41. Original User Query: {original_query}
52. MD&A Context Summary (from company filings):
6{mda_summary}
7...
8
Key lessons learned:
- Explicit formatting instructions prevent "hallucination" of non-existent charts
- Including reasoning fields helps trace LLM decisions
- Breaking complex tasks into discrete steps improves reliability
- Need to bake some evals to counter hallucinations.
Error Handling for External Services
Multiple fallback mechanisms ensure resilience:
1try:
2    response = requests.get(url, params=params, timeout=10)
3    response.raise_for_status()
4    # Process response...
5except requests.exceptions.RequestException as e:
6    # Handle API error...
7except Exception as e:
8    # General fallback...
9
Type Safety Challenges
Working with LLMs requires robust validation:
1def _ensure_serializable(data: List[Dict[str, Any]]) -> List[Dict[str, Any]]:
2    """Convert pandas Timestamps and other non-serializable types to strings in the data"""
3    serialized_data = []
4    for item in data:
5        serialized_item = {}
6        for key, value in item.items():
7            # Convert pandas Timestamps to ISO format strings
8            if isinstance(value, pd.Timestamp):
9                serialized_item[key] = value.isoformat()
10            # Convert numpy types to Python native types
11            elif isinstance(value, (np.int64, np.int32, np.int16, np.int8)):
12                serialized_item[key] = int(value)
13            # ...
14
Technical Monitoring and Observability
Structured Logging
Comprehensive logging enables effective monitoring:
1logger = logging.getLogger(__name__)
2
3# Throughout the code:
4logger.info(f"Executing {data_source_type} action: Analyzing '{csv_path}' with LLM-driven query: '{query_desc}'")
5logger.error(f"Error during QDRANT_MDA action for query '{query[:50]}...': {str(e)}")
6
State Transition Tracking
The graph structure enables clear visibility into the workflow:
1def should_iterate_node(state: AgentState) -> Literal["refine_hypotheses", "synthesize_comprehensive_explanation"]:
2    current_iter = state.get("current_iteration", 0)
3    max_iter = state.get("max_iterations", 1)
4
5    logger.info(f"DEBUG should_iterate_node: Current Iteration (completed): {current_iter}, Max Iterations: {max_iter}")
6    # ...
7
Compliance Note — Audit Trail Persist every hypothesis, evidence artifact, confidence update, and LLM response with a UUID + timestamp. This is invaluable for audits and post-mortems. Financial applications require comprehensive traceability.
Conclusion and Key Takeaways
The financial analysis agent demonstrates how structured LLM workflows can solve complex domain-specific problems:
- Hypothesis-driven investigation produces more focused, relevant insights than unstructured analysis
- Multi-source evidence gathering enables comprehensive understanding through triangulation
- Confidence scoring makes uncertainty explicit, enhancing decision quality
- Graph-based workflows provide a modular, extensible architecture for complex AI systems
- Type safety with Pydantic ensures reliable operation when integrating LLMs with structured data
Note — Evaluate Before Deploying Run dataset-driven evals (precision of hypothesis confirmations, hallucination rate) before exposing the agent to analysts. Automate nightly regression tests to catch drift. Current research shows that continuous evaluation is critical for maintaining LLM system performance over time.
The architecture can be extended to other domains requiring systematic investigation, hypothesis testing, and evidence-based conclusions - from scientific research to complex diagnostics.
Expert Implementation Support
Need help implementing this architecture for your financial analysis system?
I specialize in designing and implementing advanced LLM-powered agent systems with a focus on financial analysis, data integration, and hypothesis-driven workflows. Having built multiple production systems using LangGraph, RAG, and confidence-scored analytics, I can help your team:
- Design custom agentic workflows tailored to your financial data ecosystem
- Implement robust type safety and validation layers for LLM outputs
- Establish confidence scoring methodologies aligned with your risk tolerance
- Create seamless integrations with your existing data infrastructure
- Train your engineering team on LangGraph and agent development best practices
Book a technical discovery session: Schedule a 30-minute consultation where we'll discuss your specific implementation challenges and identify the fastest path to a production-ready system. Email saumil@saumilsrivastava.ai or visit saumilsrivastava.ai/book-consultation to get started.